
 Shopify
 WooCommerce
 API
This page always carries the latest edition of our quarterly report. You are reading the Q3 2026 edition, published October 20, 2026; earlier editions are listed under previous editions.
What happens when an online store adds virtual try-on? This edition answers with measured data from 890 stores and over 282,000 completed try-ons, July 1 to September 30, 2026. New this quarter, we follow shoppers past the cart to the order: what they buy after a try-on and how long they take to decide.
It is first-party data from our own platform, with the full methodology below. Every stat has a stable anchor, so feel free to cite any number here.
Key findings
The sample
- 890 stores with at least one completed try-on, up from 577 in Q2 (874 on Shopify, the rest on WooCommerce, PrestaShop, and Shopline).
- Over 282,000 completed try-ons, up 81% on Q2, from about 155,000 shoppers across nearly 44,000 products.
- Mostly fashion, plus eyewear, swimwear, footwear, wigs, and pet apparel, with shoppers worldwide.
Try-on sessions add to cart 2.9x more
Sessions with at least one try-on ended with an add-to-cart 33.3% of the time, against 11.3% for sessions without, across nearly 20 million storefront sessions.
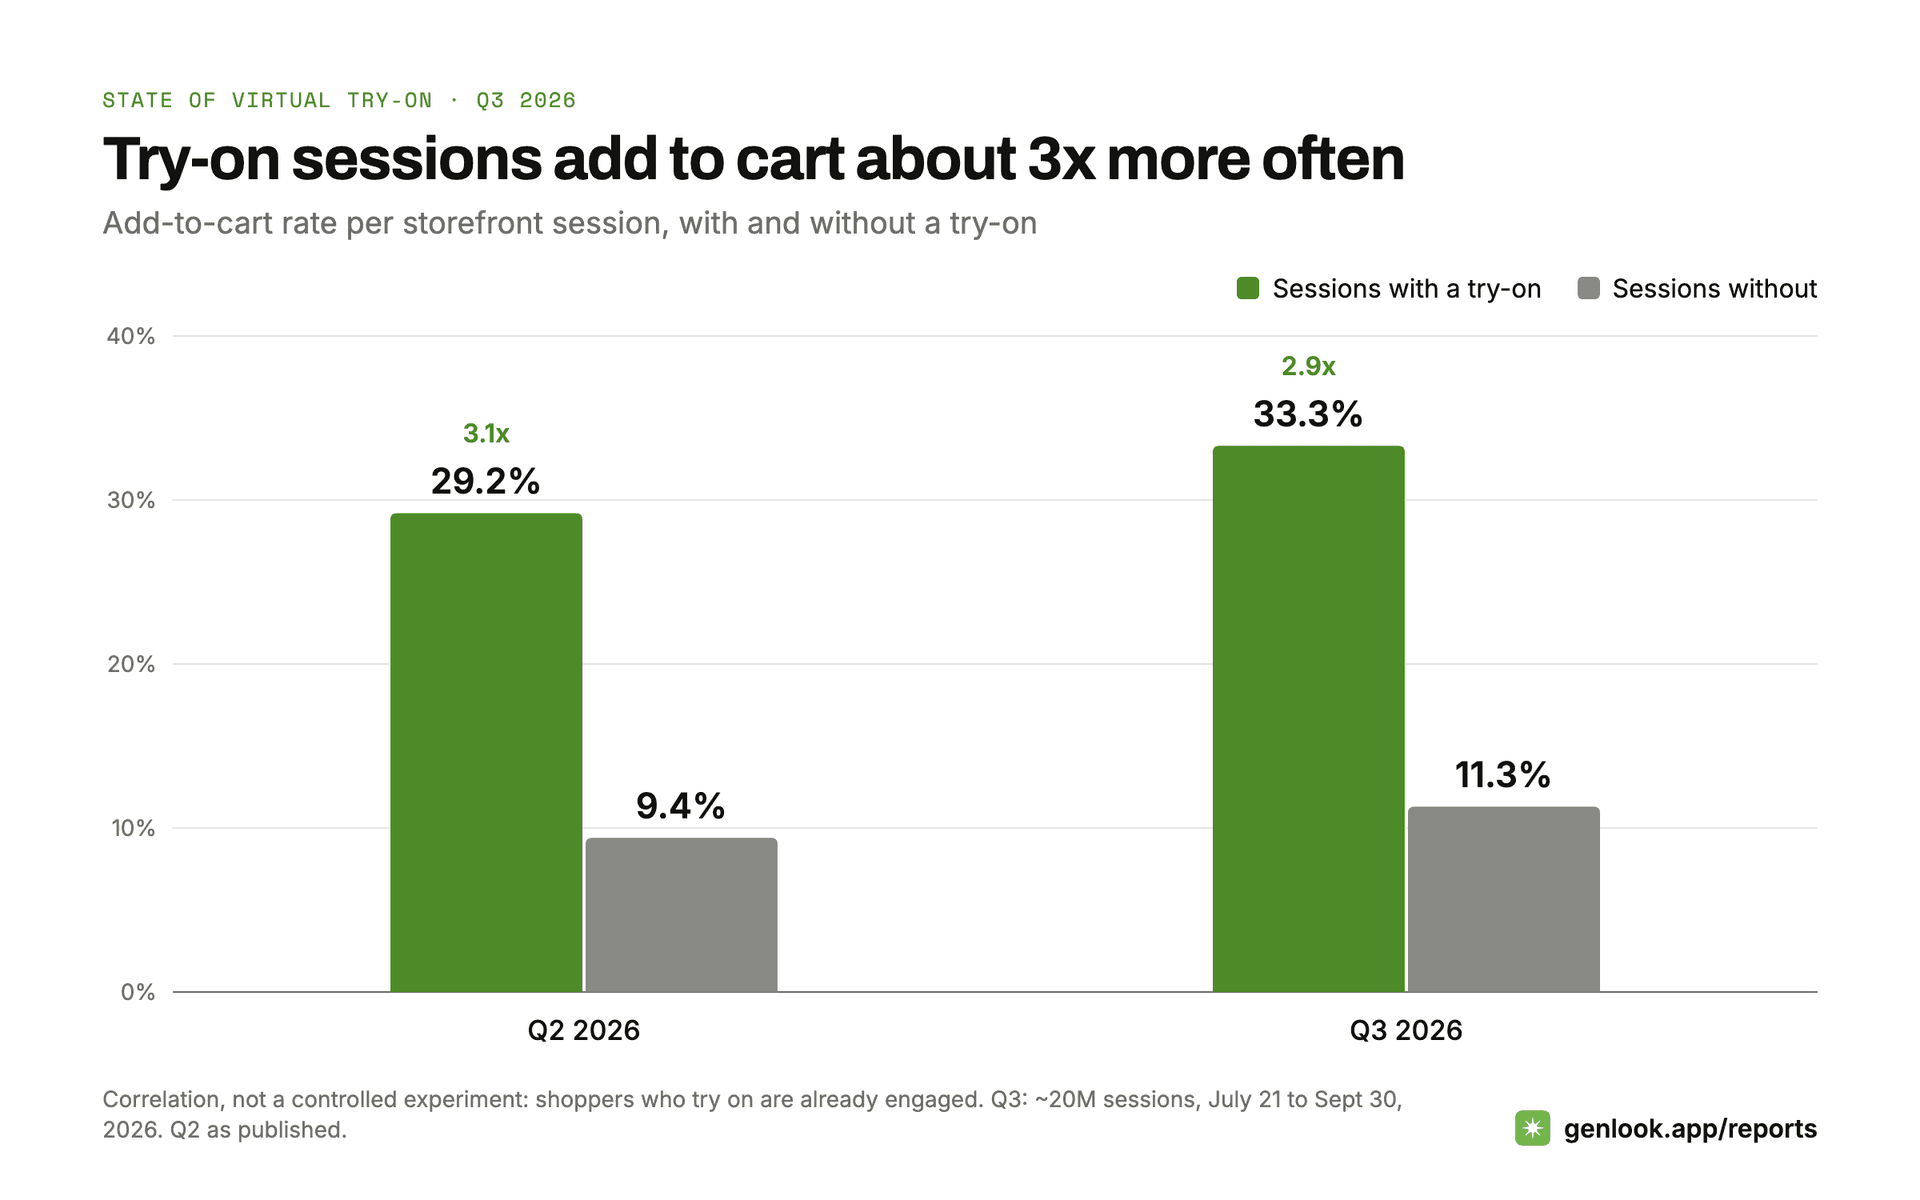
The gap is not driven by a few large stores: of the 166 stores with at least 30 try-on sessions, 164 saw try-on sessions add to cart more often than their other sessions. Shoppers who try on are already engaged, so this mixes the feature's effect with self-selection. Either way, try-on finds and serves your highest-intent visitors.
What shoppers buy after a try-on
From August 4 to September 30, shoppers who had tried something on in the previous 30 days placed 14,000 orders worth $1.43 million. 64% of those orders include the exact product the shopper tried on, and the median order is $64, against $52 for other orders at the same stores. The value gap is descriptive: try-on shoppers may simply be considering pricier items.
Seen from the try-on side, 6.7% of try-ons end with an order for that exact product, about one in fifteen. Dresses lead at 7.9%; eyewear trails at 4.1%, likely because glasses shoppers try many frames before picking one.
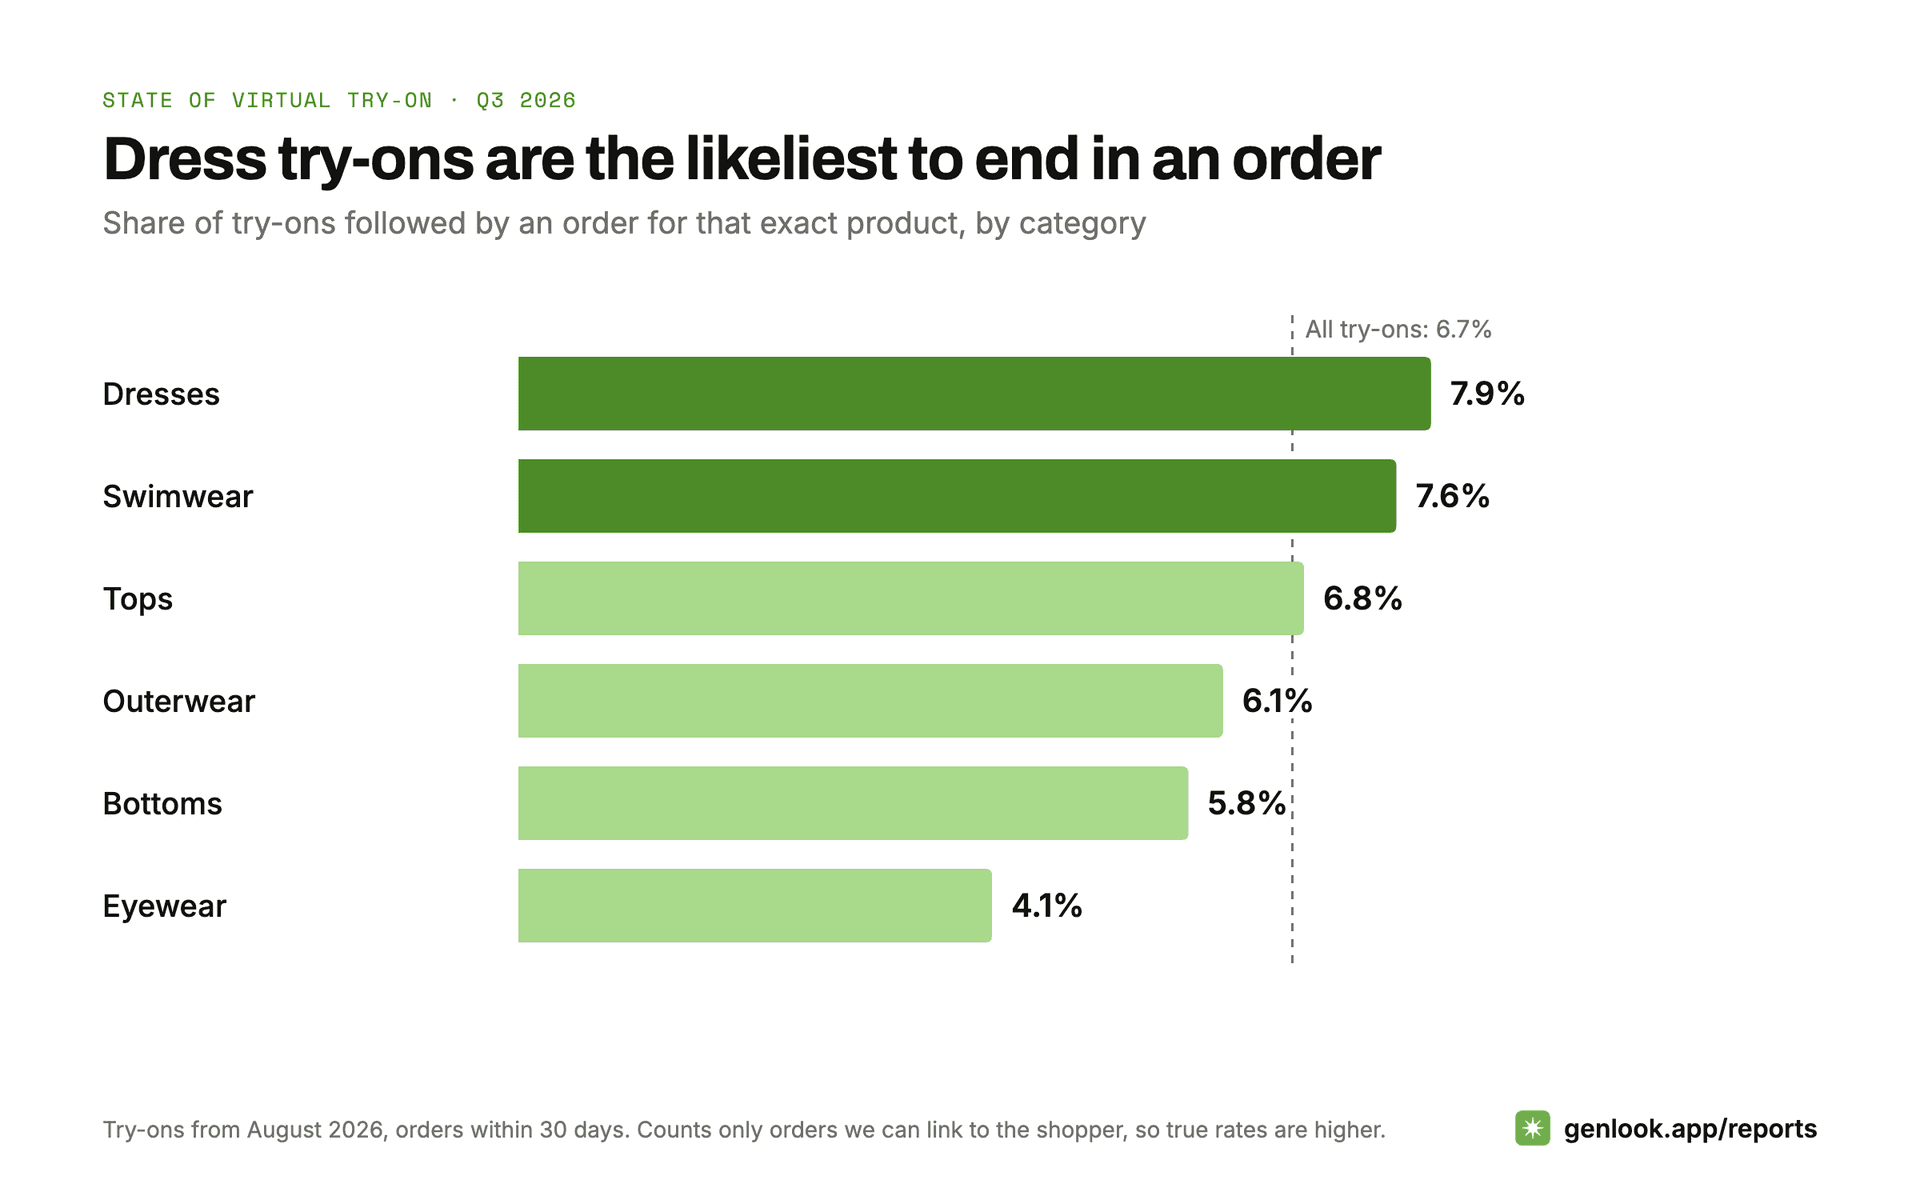
These are lower bounds: a shopper who switches device before buying is missed.
Shoppers decide fast, or come back later
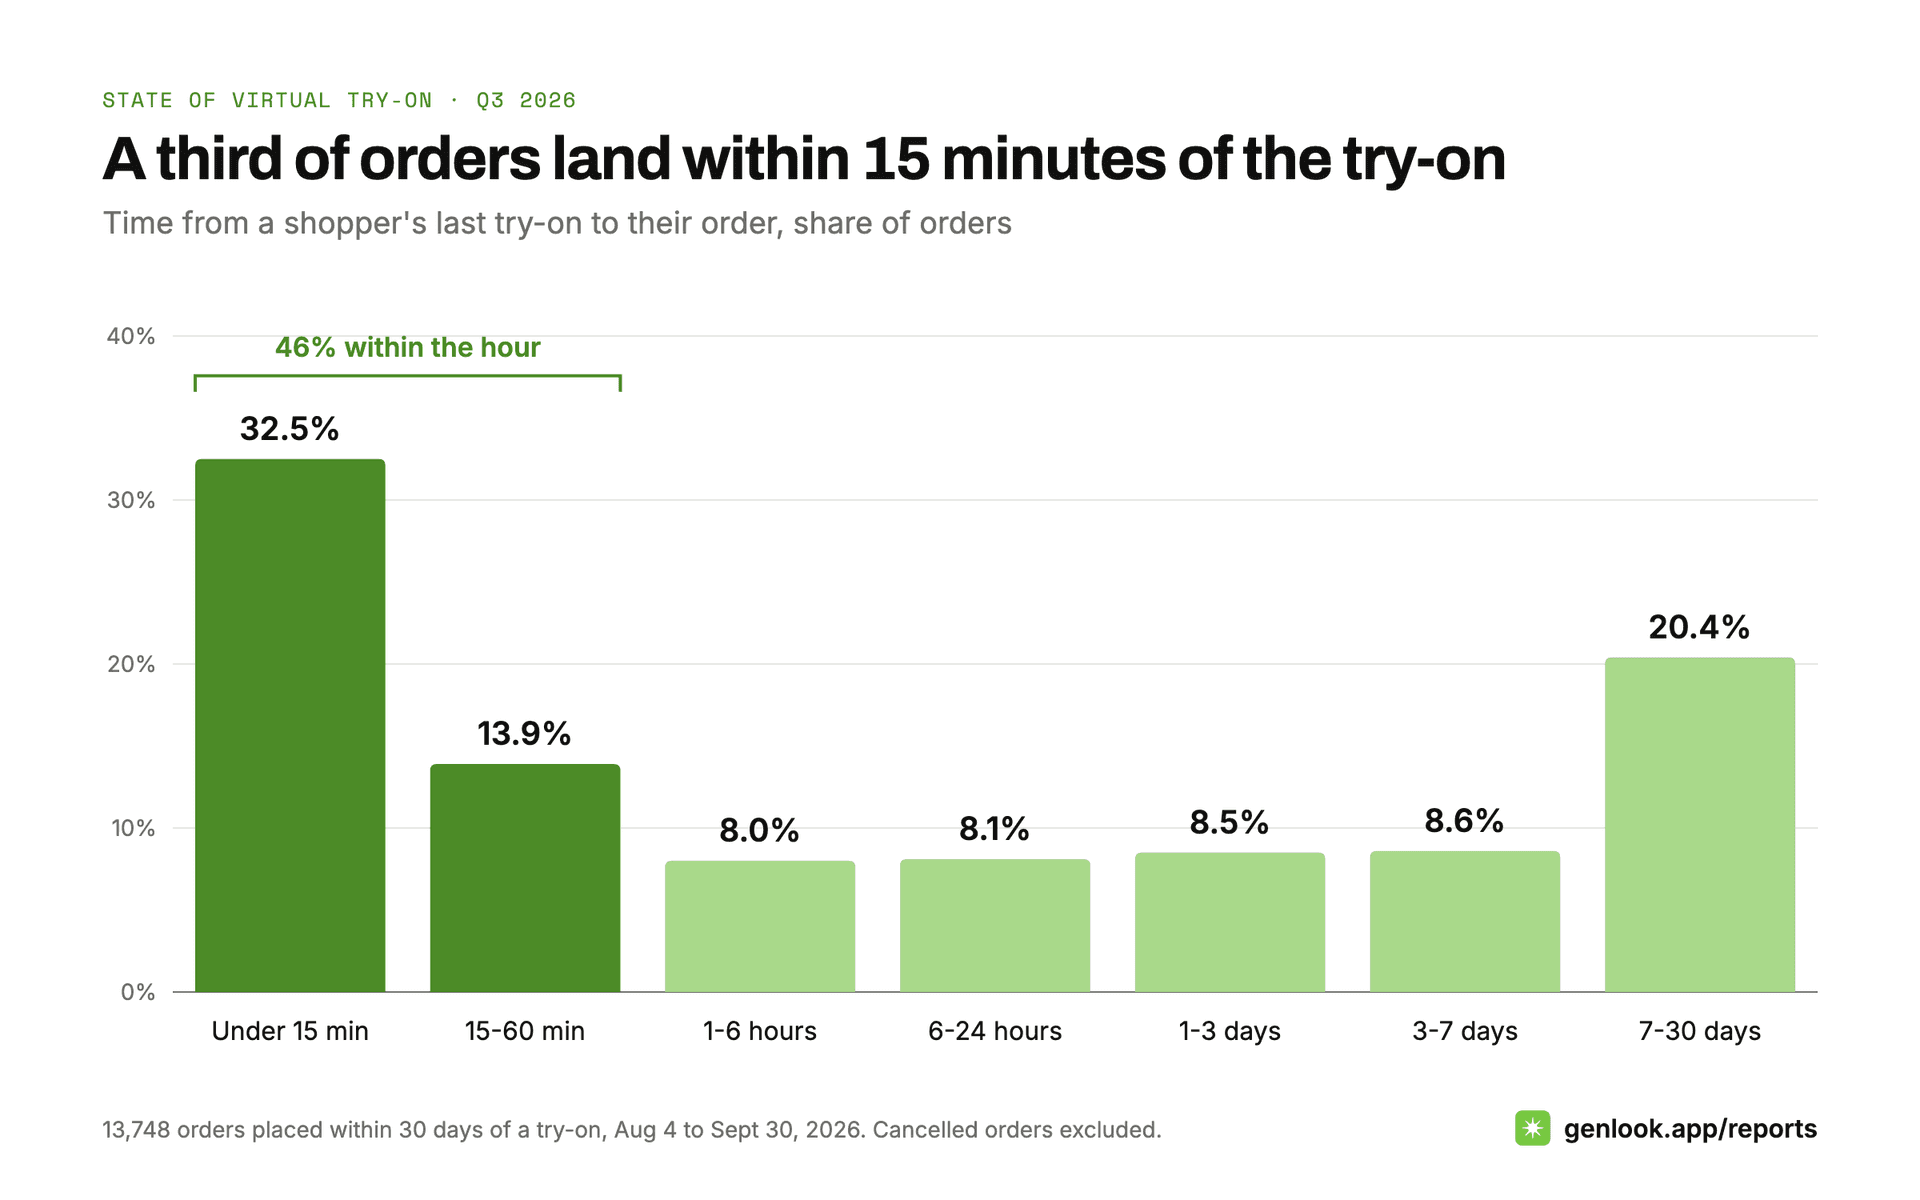
One order in three comes within 15 minutes of the try-on, and 46% within the hour: the shopper sees the look, goes back to the product page, and checks out in the same visit. At the other end, one order in five comes more than a week later, which is why try-on results that stay available (history, shared links, email) keep working after the session ends.
Comparing looks goes with buying
Shoppers average 1.8 try-ons each, and 34% generate more than one. About half of repeat try-ons reuse a photo the shopper already uploaded, so the next look is a single tap away.

Shoppers who generated three or more looks placed an order twice as often as those who stopped at one (21% vs 10%). Part of that is who they are: someone close to buying explores more. But it shows where to invest: making the second and third try-on effortless serves exactly the shoppers most likely to buy.
The photo is where shoppers drop off
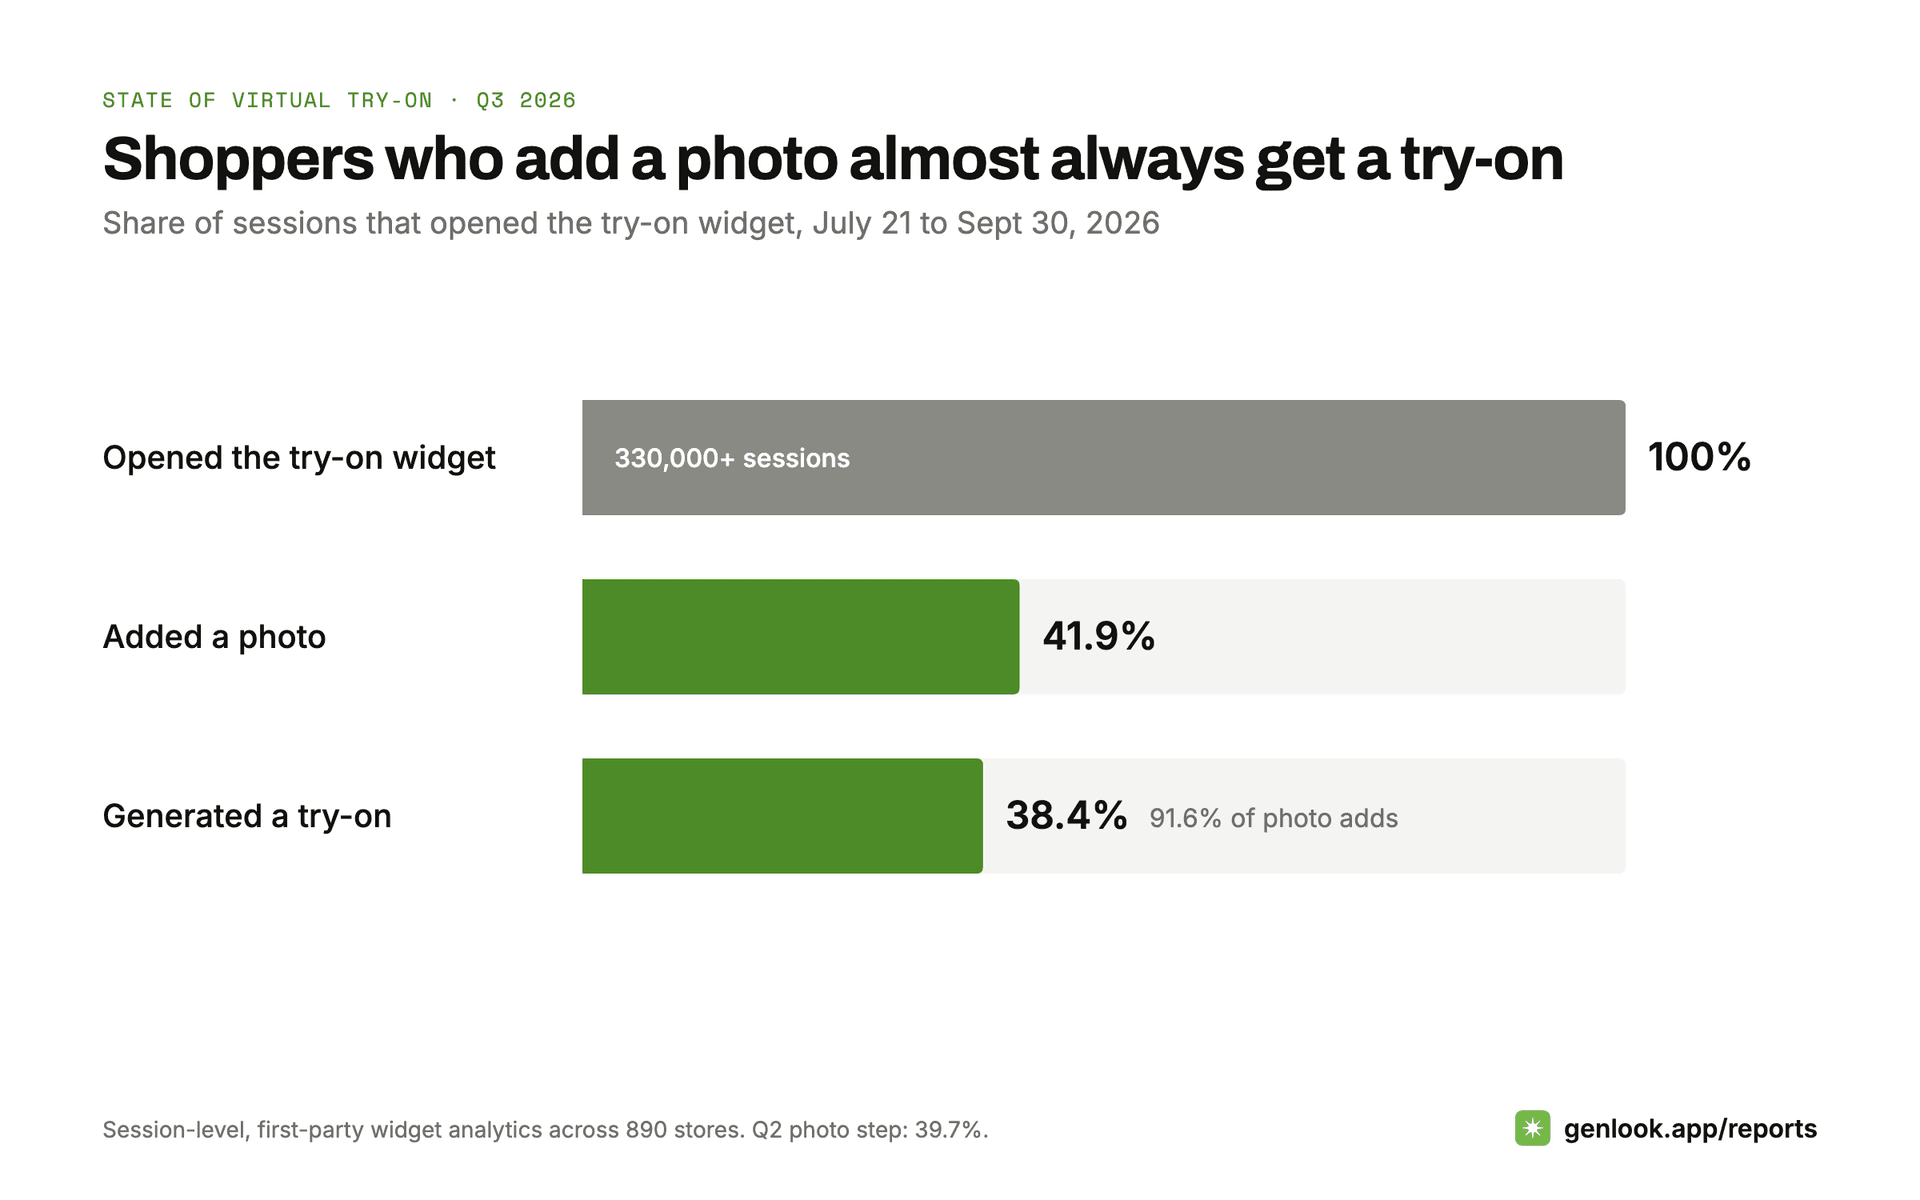
Across more than 330,000 sessions that opened the widget, 41.9% added a photo (up from 39.7% in Q2), and more than nine in ten of those went on to see their try-on. Clear guidance, a visible privacy promise, and photo reuse are where the funnel is won. And since 92% of try-ons happen on a phone, judge any try-on experience on mobile first.
Speed: a step change at the end of the quarter
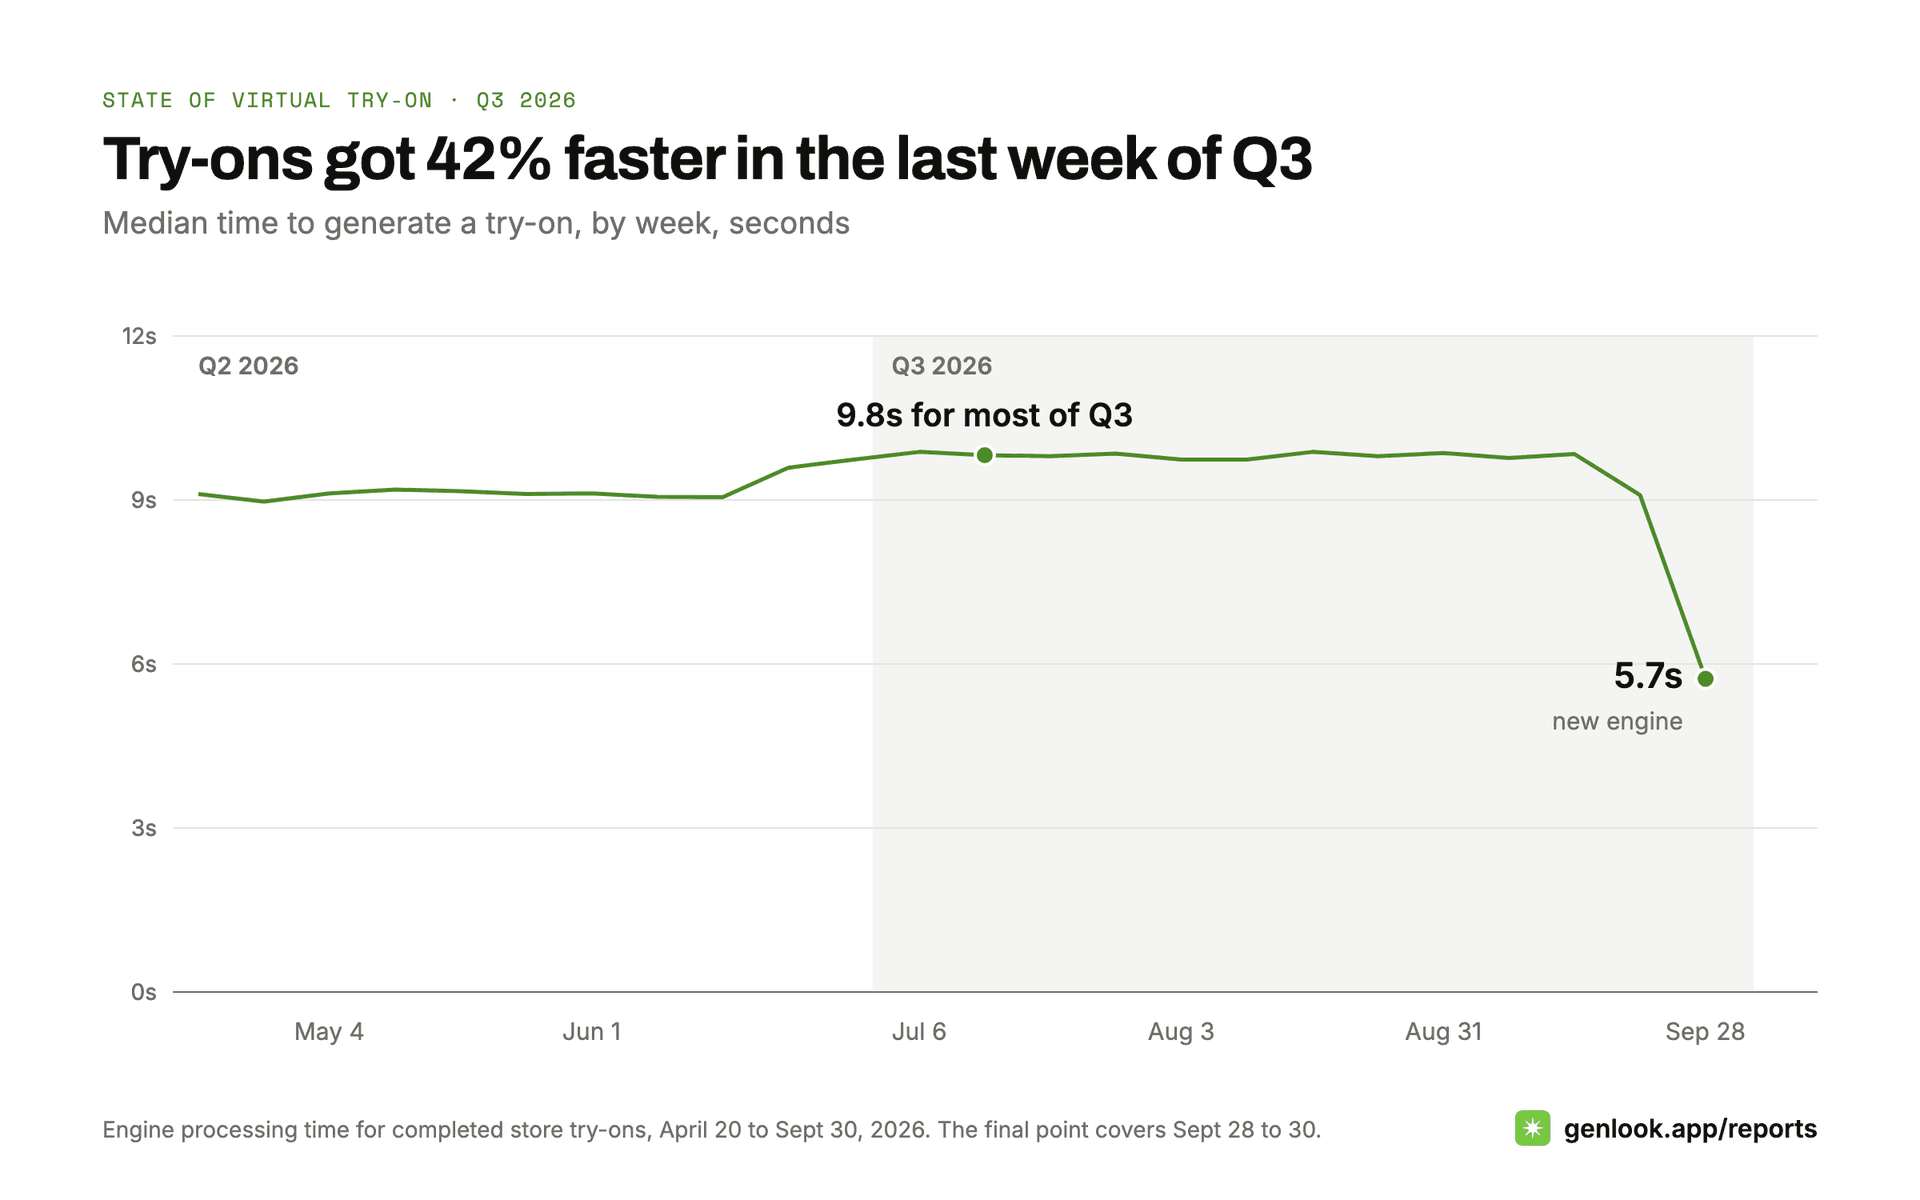
The median try-on took 9.8 seconds over the quarter, with 98.8% generating successfully. A new engine rolled out in the last week of September and cut the median to 5.7 seconds (8.1 seconds counting upload and queue time). With 46% of orders landing within the hour, keeping the shopper on the product page while the look renders is what matters.
Sharing, products, and countries
- Sharing: 5.8% of try-on shoppers tap share (up from 4.8% in Q2), and 64% of them complete it. Your item, on a real person the recipient knows, sent peer to peer.
- Products: clothing is 88.5% of try-ons, led by tops (29%) and dresses (24%), and 60% of try-ons are on women's products. Demand concentrates on hero products: the top 10% of products collect 62% of all try-ons.
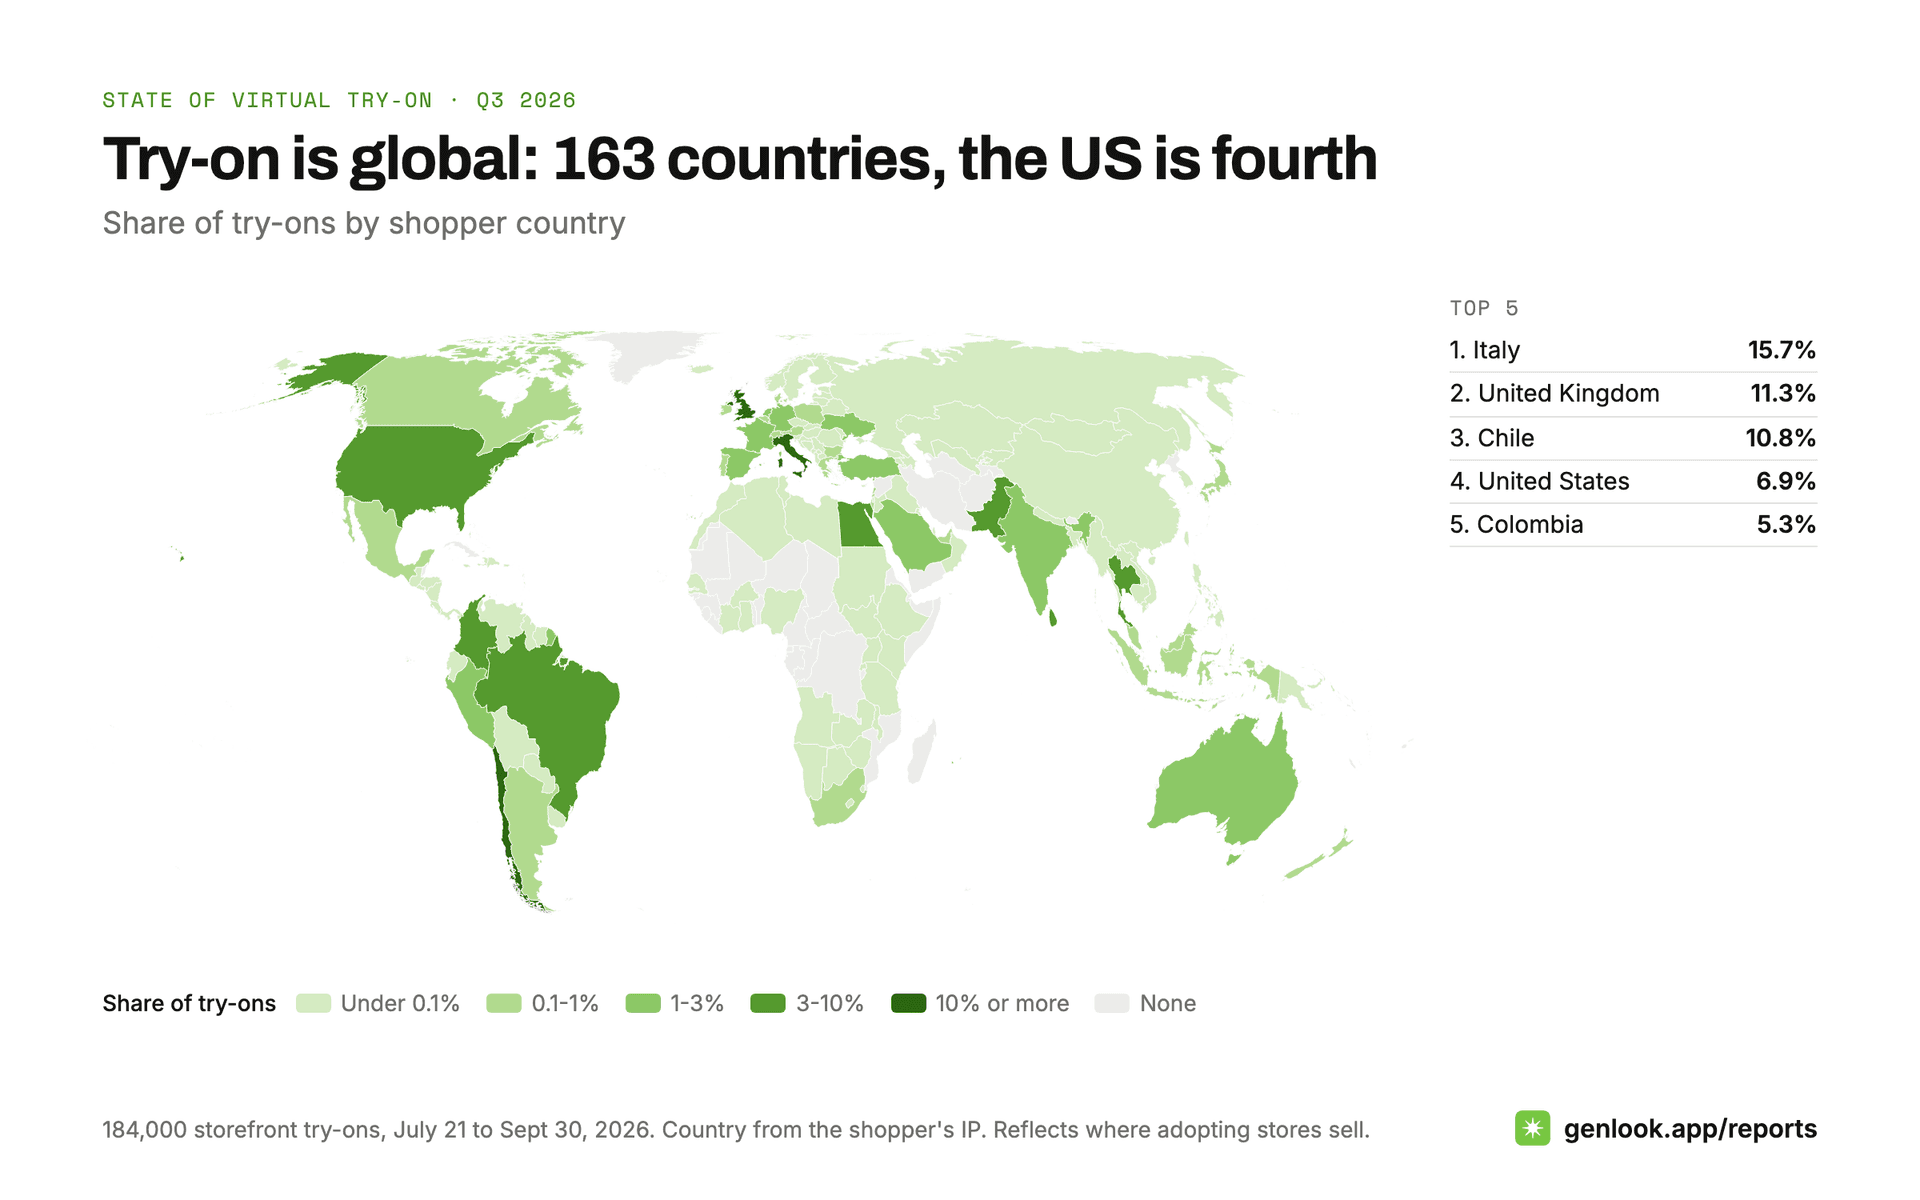
- Countries: shoppers in 163 countries used try-on. The United States ranks fourth, behind Italy, the United Kingdom, and Chile. This mostly reflects where adopting stores sell, but it is clear that try-on is not a US-first behavior.
Q3 2026 at a glance
| What we measured | Q2 2026 | Q3 2026 |
|---|---|---|
| Active stores | 577 | 890 |
| Completed try-ons | 156,000+ | 282,000+ |
| Add-to-cart rate, sessions with a try-on | 29.2% | 33.3% |
| Add-to-cart rate, sessions without | 9.4% | 11.3% |
| Orders after a try-on with the product tried on | 64% | |
| Try-ons followed by an order for that product | 6.7% | |
| Orders placed within an hour of the try-on | 46% | |
| Widget openers who add a photo | 39.7% | 41.9% |
| Try-ons on mobile | 90% | 92% |
| Median generation time | 9.2s | 9.8s |
| Try-on shoppers who share a look | 4.8% | 5.8% |
Methodology
- Window: July 1 to September 30, 2026. Q2 covered April 16 to June 30, two weeks shorter, so part of the volume growth is calendar. Q2 values are as published in the Q2 edition.
- Sample: the 890 stores running the Genlook widget with at least one completed try-on in the window. Stores adopting try-on skew fashion-forward, so these numbers describe stores that chose VTO, not e-commerce at large.
- Server-side figures (try-on counts, speed, success rate, categories, devices, photo reuse, product concentration) cover the full quarter. Generation time is the engine's processing time. Devices come from each try-on's browser user agent.
- Storefront figures (funnel, sessions, add-to-cart, sharing, countries) come from first-party widget analytics, July 21 to September 30, after a four-day analytics outage. Shoppers who decline analytics cookies are not counted. Countries come from the shopper's IP address.
- Add-to-cart is a session-level correlation, not a controlled experiment, so treat 2.9x as how try-on sessions convert, not as a promised lift. On high-traffic stores we sample product page views, which raises the "without try-on" rate and makes the gap conservative.
- Orders cover August 4 to September 30, when order-level attribution went live. An order counts as "after a try-on" when the same shopper completed a try-on at that store in the 30 days before ordering. Cancelled orders are excluded, values are in USD at the daily rate, and time to order runs from the shopper's last try-on.
- Purchase rate per try-on and orders by number of try-ons use try-ons from August 4 to 31, so each has a full 30 days to turn into an order. A try-on counts as purchased when a linked order contains the same product.
- All numbers are aggregates. No shopper-identifiable data was used, and no store-level data is reported.
Previous editions
- Q3 2026: the edition shown on this page, kept at a fixed address.
- Q2 2026: 577 stores, 156,000 try-ons, April 16 to June 30, 2026.
How to cite this report
Genlook, State of Virtual Try-On: Q3 2026. First-party data from 890 stores, July 1 to September 30, 2026. https://genlook.app/reports/state-of-virtual-try-on
This address always shows the latest edition. To quote a figure that must not change, link the dated copy of this edition instead: https://genlook.app/reports/state-of-virtual-try-on-2026-q3. Each stat card has a stable anchor (for example #atc-lift, #product-match, #purchase-rate) that works on both. If you quote the add-to-cart comparison, please keep its context: try-on users are engaged shoppers, and 2.9x describes their sessions, not a guaranteed uplift.
Where to go from here
New to the technology? Start with what virtual try-on is. Choosing tools? See our comparison of Shopify try-on apps, including the honest trade-offs of our own. And to see these numbers on your own catalog, Genlook installs free.
FAQ
Questions, answered.
How much does virtual try-on increase add-to-cart rate?↓
In Genlook's Q3 2026 data across 890 stores, sessions with at least one try-on added to cart at 33.3%, versus 11.3% for sessions without, a 2.9x difference that showed up in 164 of the 166 stores with at least 30 try-on sessions. Try-on users are engaged, self-selected shoppers, so the number describes how try-on sessions convert rather than a guaranteed lift from installing a widget.
Do shoppers buy the product they tried on?↓
Mostly, yes. Between August 4 and September 30, 2026, 64% of the 14,000 orders placed after a try-on included the exact product the shopper had tried on. The median order after a try-on was $64, against $52 for other orders at the same stores.
What share of virtual try-ons lead to a purchase?↓
6.7% of try-ons were followed within 30 days by an order for the exact product tried on, about one in fifteen. Dresses convert best at 7.9%, eyewear lowest at 4.1%. These are lower bounds, since only orders linked back to the shopper are counted.
How long after a virtual try-on do shoppers buy?↓
One order in three is placed within 15 minutes of the shopper's last try-on, 46% within an hour, and the median gap is 2 hours. One order in five comes more than a week later, from shoppers who saved their look and came back.
How fast is AI virtual try-on in production?↓
The median generation took 9.8 seconds across Q3 2026, with 98.8% generating successfully. After a new engine rolled out in the last week of September, the median dropped to 5.7 seconds.
Where does this data come from?↓
From the Genlook virtual try-on platform: server-side generation records, first-party widget analytics on merchant storefronts, and order data with try-on attribution, across 890 active stores from July 1 to September 30, 2026. Genlook builds the widget, so this is first-party data with methodology and limitations disclosed above.